
Introduction
Around the second week of June, I decided to launch an online poll that asked one simple question: “How safe do you feel living in Barbados today?” This was not meant to be a formal survey (while that would have been more rigorous, it would also be more expensive and complicated to carry out).
My poll is basically a “man on the street” type poll that looked to measure public sentiment. Furthermore, this poll doesn’t attempt to offer sociological or criminological conclusions. It’s a data-driven look at patterns in how Barbadians perceive safety—broken down by demographics like gender, age, and parish. Long term, my plan is to run it twice a year (June and December), and compare results over time.
The poll closed at the end of June, so now it’s time to take a closer look at the results — which I’ll share over a few blog posts. This first post will briefly look at the structure of the poll, followed by a breakdown of who responded.
What did the Poll ask?
It asked one simple question: How safe do you feel living in Barbados today? Respondents chose from five options ranging from Very Safe to Very Unsafe. I also collected basic demographic information to see if responses varied based on demographics:
Gender
Age group
Parish
Employment status
Income group
When and How was the data collected?
The poll was setup using Google Forms and was open to the public from June 18 to June 30. I would have opened it sooner, but I only came up with the idea for it around June 18. It was distributed via social media (Facebook, LinkedIn), email and WhatsApp.
Limitations
The major limitation to this poll is that it is not a statistically representative sample of the entire population of Barbados. There’s likely some response bias, and the sample size, while useful, is relatively small. Still, I believe that the data can offer valuable insights, especially when compared over time.
How the Analysis was Done
As I mentioned before, the poll was setup using Google Forms. On July 1, after closing the poll, I downloaded the data into Microsoft Excel. From there, I made a copy of the file (which I used as my working copy). I removed test responses (which I created when I was testing the poll). I also removed people who answered “No” to the question: Have you lived in Barbados over the past 12 months? That left with me a total of 167 useable responses (I was hoping for between 200 to 400 responses). I then used tools like Excel and Pivot Tables to break down responses by category.
Respondent Profile (n = 167)
Before we look at responses by category (which I will keep for Part 2), here is a look at the demographic profile of respondents:
Gender:
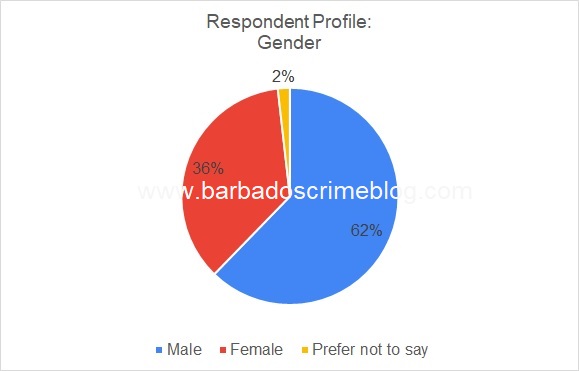
- Female: 104 (62.3%)
- Male: 60 (35.9%)
- Prefer not to say: 3 (1.8%)
Parish:
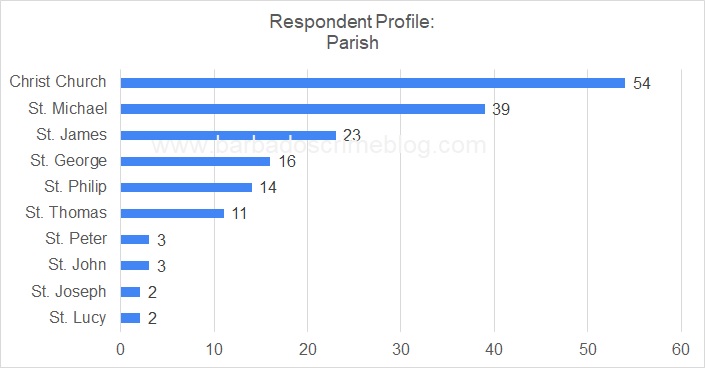
- Christ Church: 54 (32.3%)
- St. Michael: 39 (23.4%)
- St. James: 23 (13.8%)
- St. George: 16 (9.6%)
- St. Philip: 14 (8.4%)
- St. Thomas: 11 (6.6%)
- St. John: 3 (1.8%)
- St. Peter: 3 (1.8%)
- St. Lucy: 2 (1.2%)
- St. Joseph: 2 (1.2%)
Note: There were no respondents from St. Andrew.
Age Group:
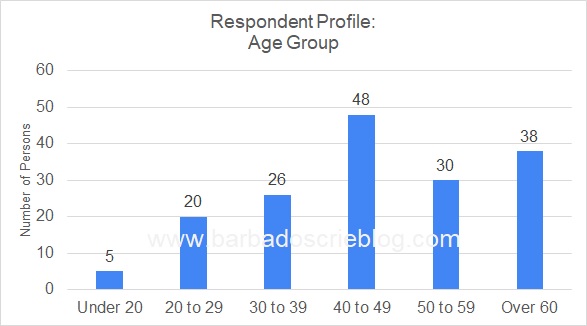
- 40 to 49: 48 (28.7%)
- Over 60: 38 (22.8%)
- 50 to 59: 30 (18.0%)
- 30 to 39: 26 (15.6%
- 20 to 29: 20 (12.0%)
- Under 20: 5 (3.0%)
Employment Status:
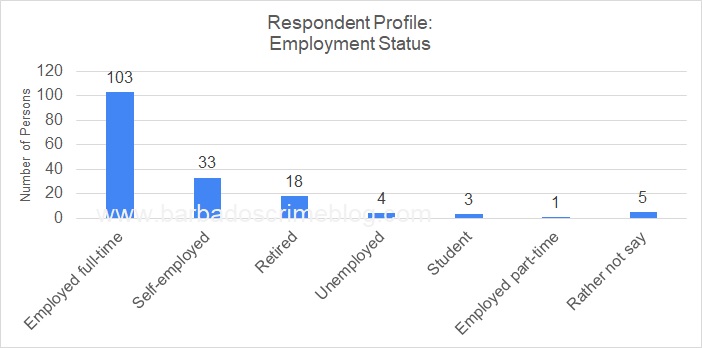
- Employed full-time: 103 (61.7%)
- Self-employed: 33 (19.8%)
- Retired: 18 (10.8%)
- Unemployed: 4 (2.4%)
- Student: 3 (1.8%)
- Employed part-time: 1 (0.6%)
- Rather not say: 5 (3.0%)
Income Group:
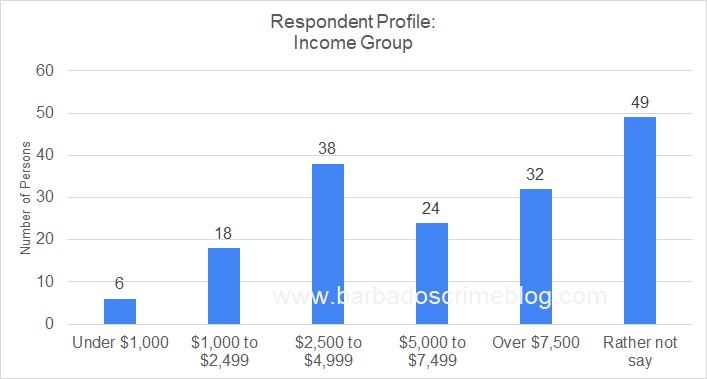
- $2,500 to $4,999 BDS: 38 (22.7%)
- Over $7,500 BDS: 32 (19.2%)
- $5,000 to $7,499 BDS: 24 (14.4%)
- $1,000 to $2,499 BDS: 18 (10.8%)
- Under $1,000 BDS: 6 (3.6%)
- Rather not say: 49 (29.3%)
That’s it for Part 1. I’ve walked through how the poll was created, how the data was collected and analyzed, and who the respondents were. In Part 2, I’ll start digging into the actual results — looking at how safety perception varies across age, gender, parish, income, and more.
Permalink