
In Part 1 of this blog series, I gave some background on the Barbados Safety Poll — how it came about, how it was run, and who responded. Now in Part 2, I dive into the actual responses and see how different groups of people answered the question:
“How safe do you feel living in Barbados today?”
I broke down the results by gender, age group, parish, employment status, and income level to see if any patterns or differences stood out. This isn’t meant to be a scientific or nationally representative survey (I only managed to get 167 useable responses), but I do think it offers some valuable insight into how safety is perceived across different parts of the population.
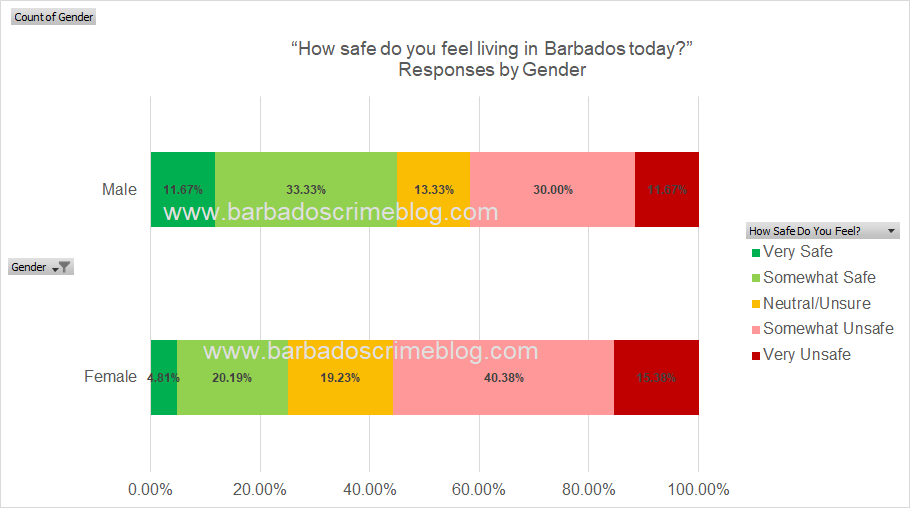
Let’s start by looking at how perceptions of safety differed between men and women:
Gender
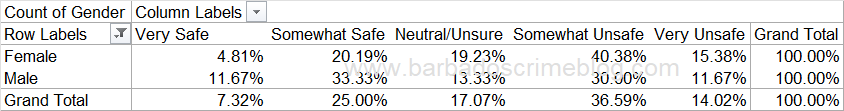
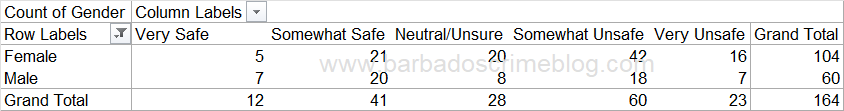
From the raw numbers and chart (below), we can see that females were more likely to feel unsafe compared to males. Specifically, 40% of female respondents said they felt somewhat unsafe and another 15% said very unsafe, totaling over half of all female responses leaning toward a sense of insecurity.
In contrast, male responses were slightly more positive, with 33% selecting “Somewhat Safe” and 12% saying “Very Safe”. While a third of males still said they felt somewhat unsafe, the overall distribution suggests that males felt slightly safer on average than females.
Interestingly, only one respondent selected “Prefer not to say,” and they chose “Neutral/Unsure,” so it doesn’t contribute meaningfully to the analysis and was removed.
Next, I looked at responses by age group to see if safety perceptions varied across different age groups.
Age Group
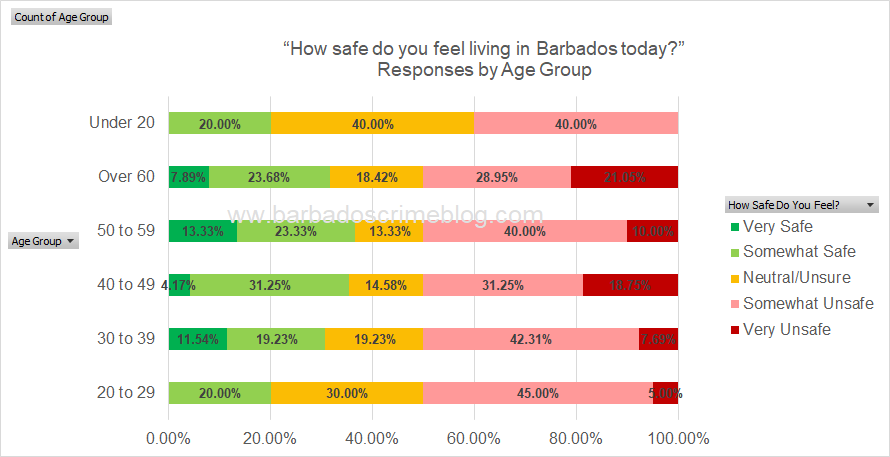
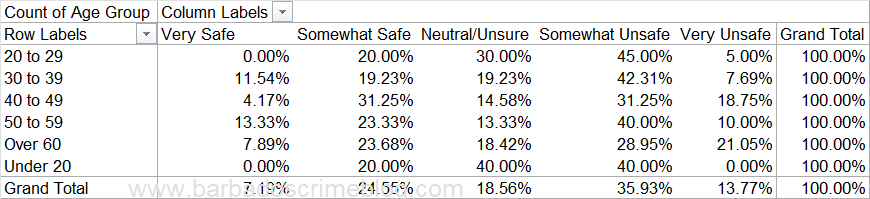
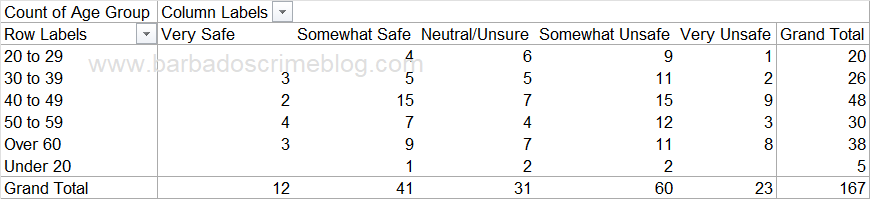
When it comes to perceived safety, age appears to play a subtle but noteworthy role. Across the different age groups, there are some interesting shifts in how safe respondents feel living in Barbados today.
In the stacked chart below, you can see how each age group responded. For instance, respondents aged 50 to 59 were among the most likely to feel “Very Safe” (13.3%), while younger adults in the 20 to 29 range reported feeling “Somewhat Unsafe” or “Very Unsafe” more frequently — 45% and 5%, respectively.
Meanwhile, the Over 60 group showed a relatively balanced spread across response categories, though they had one of the highest rates of “Very Unsafe” responses at 21.1%. Interestingly, the Under 20 group, though a small sample, had no respondents reporting feeling “Very Safe” — a small but telling detail.
I also examined whether location played a role by breaking down responses by parish.
Parish
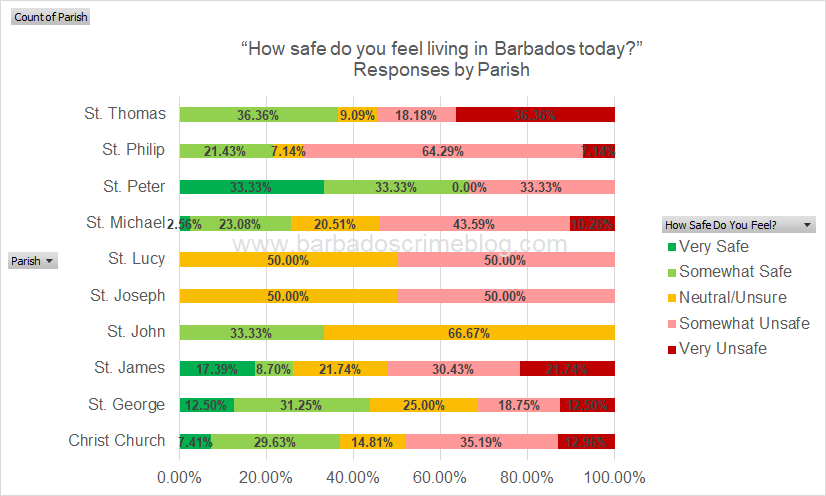
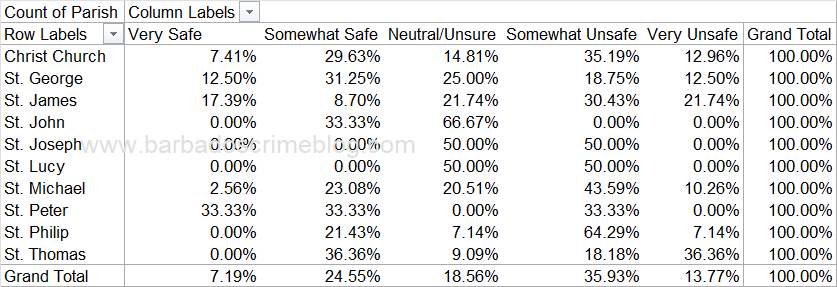
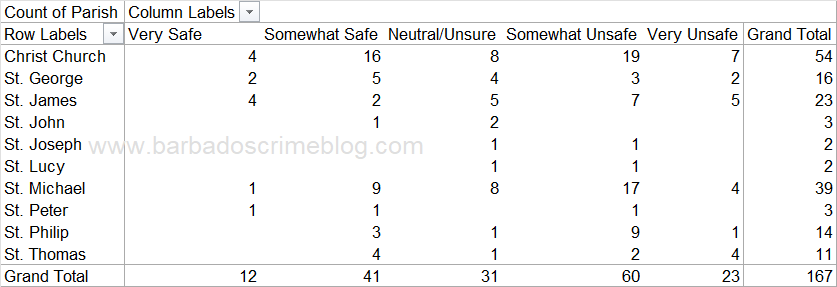
When we break down responses by parish, some clear patterns start to emerge — though we should keep in mind that some parishes had just a handful of respondents (unfortunately, there were no respondents from St. Andrew). For example, Christ Church, the parish with the most responses, had the highest count of people feeling “somewhat safe,” but also a notable share who felt “somewhat unsafe” or “very unsafe.”
Meanwhile, St. Philip and St. Michael leaned heavily toward the “unsafe” side of the spectrum, with over 50% of respondents in both parishes selecting either “somewhat unsafe” or “very unsafe.” In contrast, St. Peter and St. Thomas had relatively stronger showings in the safer categories, though the number of respondents there was quite small.
These results hint at localized differences in how residents perceive safety — possibly linked to crime patterns, media coverage, or personal experience — but again, the sample sizes for some parishes mean we should be cautious about over-interpreting the results.
Another dimension I explored was employment status, to find out if working status had any noticeable effect on how safe people felt.
Employment Status
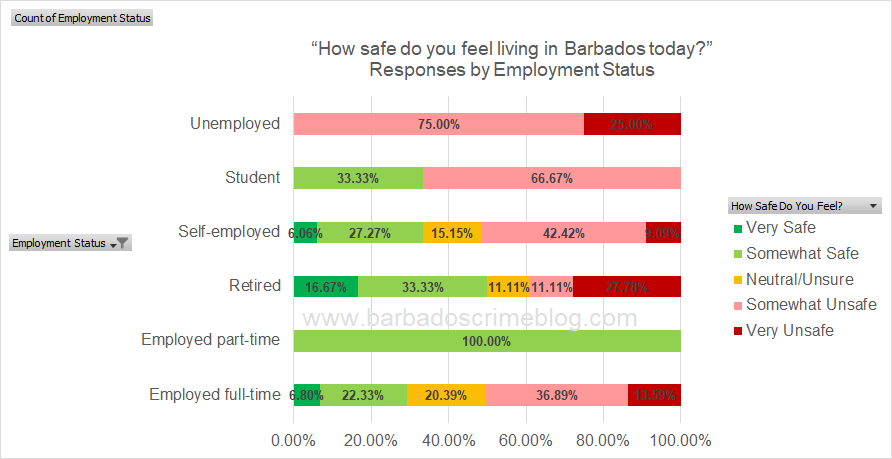
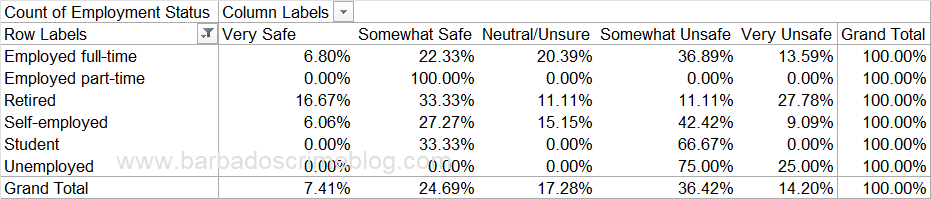
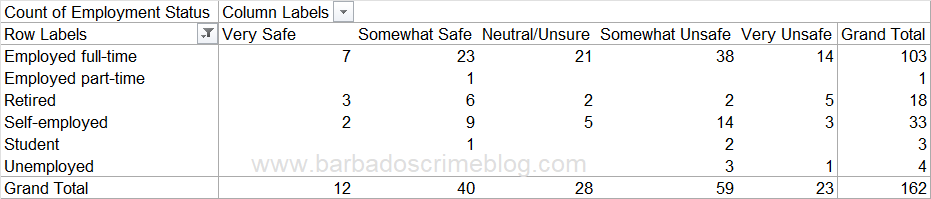
Respondents’ feelings of safety also varied by employment status. Full-time workers showed a fairly balanced spread of responses, with over one-third feeling “Somewhat Unsafe.” Among the self-employed, the most common response was also “Somewhat Unsafe,” though a significant number reported feeling “Somewhat Safe.” Note: There was only respondent who was Employed part-time, hence the 100% result for “Somewhat Safe”.
Retirees stood out as more likely to feel “Very Safe” or “Somewhat Safe” compared to other groups, while unemployed individuals expressed the highest levels of concern—75% selected “Somewhat Unsafe” and another 25% chose “Very Unsafe.”
Finally, I looked at income levels to see if economic standing appeared to influence safety perceptions.
Income Level
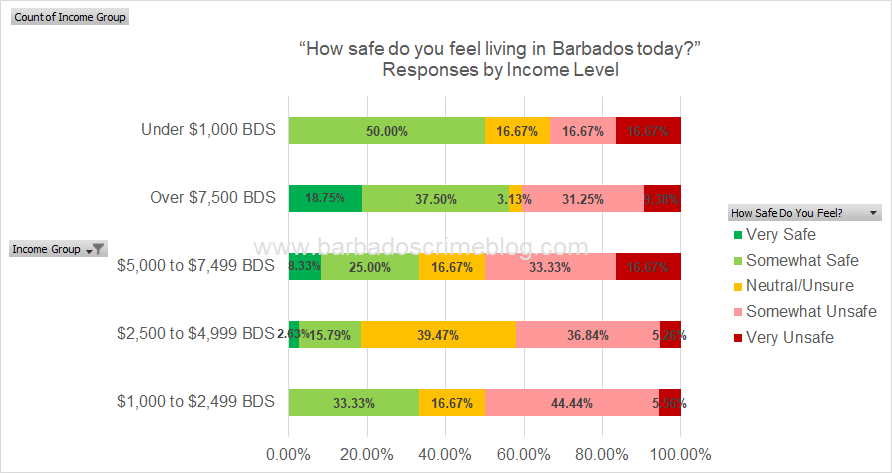
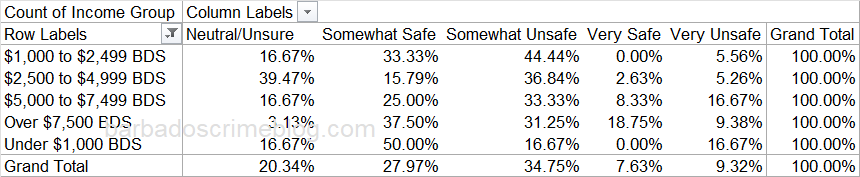
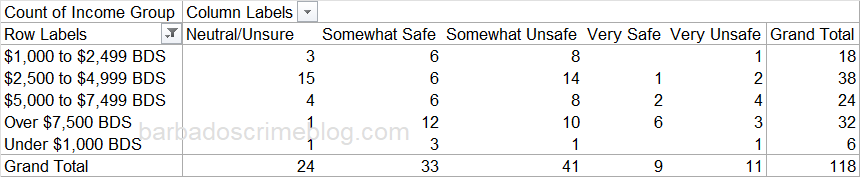
When we look at safety through the lens of income, the results don’t point in one clear direction. People earning over $7,500 BDS per month were the most likely to report feeling “Very Safe” (18.75%)—perhaps reflecting greater access to secure housing or safer environments. But surprisingly, those earning under $1,000 BDS also showed a high percentage of positive responses (50% “Somewhat Safe”), though it’s worth noting the small sample size in that group.
Meanwhile, respondents earning between $1,000 and $4,999 BDS were more likely to say they felt “Somewhat Unsafe” or “Very Unsafe,” with nearly half of the lowest middle-income bracket reporting unease. This middle segment might feel the pinch of insecurity without the financial cushion that higher earners may enjoy—or the adaptive resilience of lower earners.
Overall, income seems to play a role in shaping how safe people feel, but it’s clearly not the only factor.
Conclusion
In this post, I looked at how different groups of people responded to the safety question — by gender, age, parish, job status, and income level. Again, this wasn’t a scientific or nationally representative survey. It was a simple online poll, open to anyone who wanted to take part.
Still, the results are interesting. They give us a sense of how different segments of the population are feeling, and maybe even point to areas worth digging into more. With five demographic categories analyzed, there are actually thousands of possible combinations — like young males in St. Michael, or retired females in St. Philip — so there’s definitely room to explore this further in the future!
Finally, I’d like to thank everyone that took the time to complete the poll, see you in December!
Hi Amit, good day.
Hope you’re doing well.
Nice poll! I do have a quick observation regarding the percentages shown. Try to avoid using overly precise figures like 16.67%. They can give a false sense of accuracy and make your tables look cluttered. It’s clearer to round them—so use 17% instead of 16.67%.
Keep up the good work!