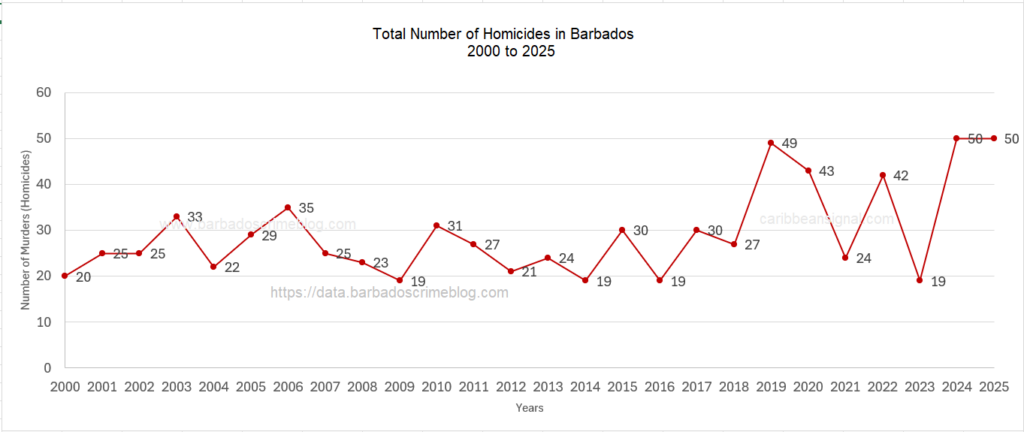
There have been at least 761 homicides (2000–2025) in Barbados — roughly 30 per year on average.
For clarity:
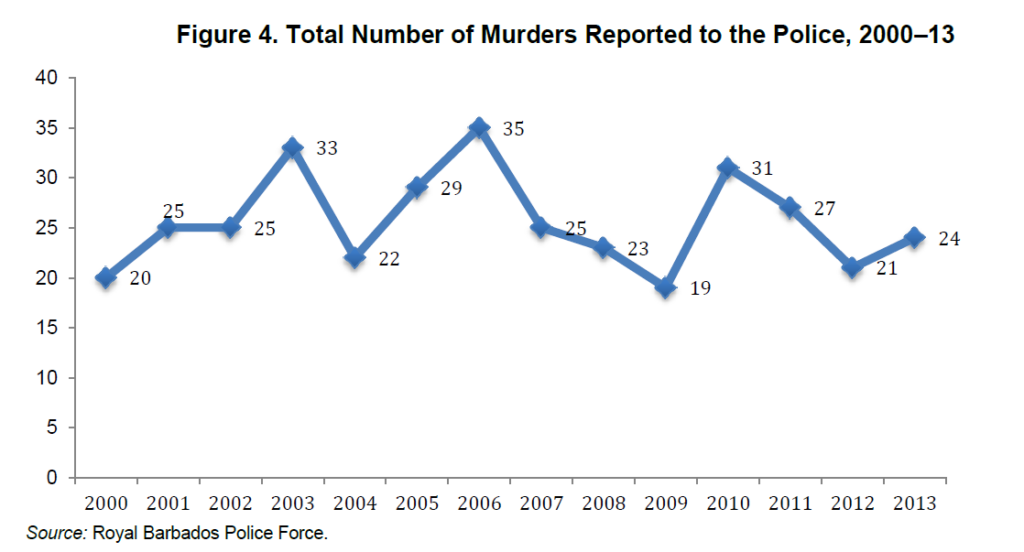
• 2000–2013 figures are from an Inter-American Development Bank (IDB) report based on data from The Barbados Police Service.
• 2014–2025 figures are from my own data collection.
I track homicides in Barbados. My data is not official. I started around 2017/2018 doing monthly posts, including a Murder Map (now Homicide Map), first on CaribbeanSignal.com and more recently on BarbadosCrimeBlog.com. These posts were based on mainstream media reports and information from The Barbados Police Service — not anonymous IG or FB pages.
Over time, I wanted to move from static monthly reports to a more dynamic setup. One were I could generate charts or reports on the fly. I needed a database. So I built one.
The Barbados Homicide Database (data.barbadoscrimeblog.com) allows anyone to view real-time charts and generate reports. I still have to ensure it stays up to date based on the latest information. The methodology behind the database is similar to my blog posts — media reports and police information. Again, the data is not official.
The database now contains data on at least 400 homicides going back to 2014. My present goal is to go back to the year 2000 using media reports (both online and offline).
The IDB chart below has been helpful (it is based on data from The Barbados Police Service). It gives me a target when researching earlier years. If the official total says 31 for a particular year, then I know I need to find 31 cases in via media reports or TBPS information.
As always, my aim isn’t just yearly totals. It’s low-level data like month, parish, gender, age, method, day of the week, and any time-related information.
Below is the original IDB chart (2000–2013) cropped from their June 2016 Technical Note (IDB-TN-1059) Crime and Violence in Barbados, IDB Series on Crime and Violence in the Caribbean by Corin Bailey. Underneath that, an updated chart including my numbers from 2014–2025.